
What’s a Rich Text element?
The rich text element allows you to create and format headings, paragraphs, blockquotes, images, and video all in one place instead of having to add and format them individually. Just double-click and easily create content.
Static and dynamic content editing
A rich text element can be used with static or dynamic content. For static content, just drop it into any page and begin editing. For dynamic content, add a rich text field to any collection and then connect a rich text element to that field in the settings panel. Voila!
How to customize formatting for each rich text
Headings, paragraphs, blockquotes, figures, images, and figure captions can all be styled after a class is added to the rich text element using the "When inside of" nested selector system.
- This is it.
Introduction
Silico is a new business simulation platform that allows you to build a Digital Twin of your Enterprise (DTE) to monitor your business, forecast its future state, and simulate the impact of decisions virtually before implementing them in the real world. Essential components of your DTE are the representations of your business processes, such as lead-to-order, order-to-cash, or service processes, which you can build with our Business Process Simulation (BPS) methodology. These Digital Twins of your processes help your business to forecast key business outcomes, for example, capacity requirements and match them to fluctuating demand, as demonstrated in our partnership with EdgeTI.
In previous blog posts, we have converted a simple process map into a Silico simulation model and added quantitative variables to determine and steer process flow. This resulted in the following simulation model showing the key business outcomes of an order-to-cash process:

What Key Business Outcomes can you Link in a Simulation Model?
In this blog, we will link the process model to key business process outcomes, including:
- Effort per case and resulting unit costs
- Backlogs
- Lead time of new cases
- Revenues
- Fixed costs
- Profit and cash flow

Effort per Case and Unit Costs
When adding variables to the process model to quantify and steer throughput, we’ve added processing times in hours per order to the model. These quantify the effort required per order at each process step. To determine the total effort required per order, we can sum up the individual processing times in a variable called “Effort per Order”. Capturing processing times per order allows us to quantify how changes to productivity levels through new technology, such as robotic process automation (RPA), will impact future flow rates of orders in the process and their costs.
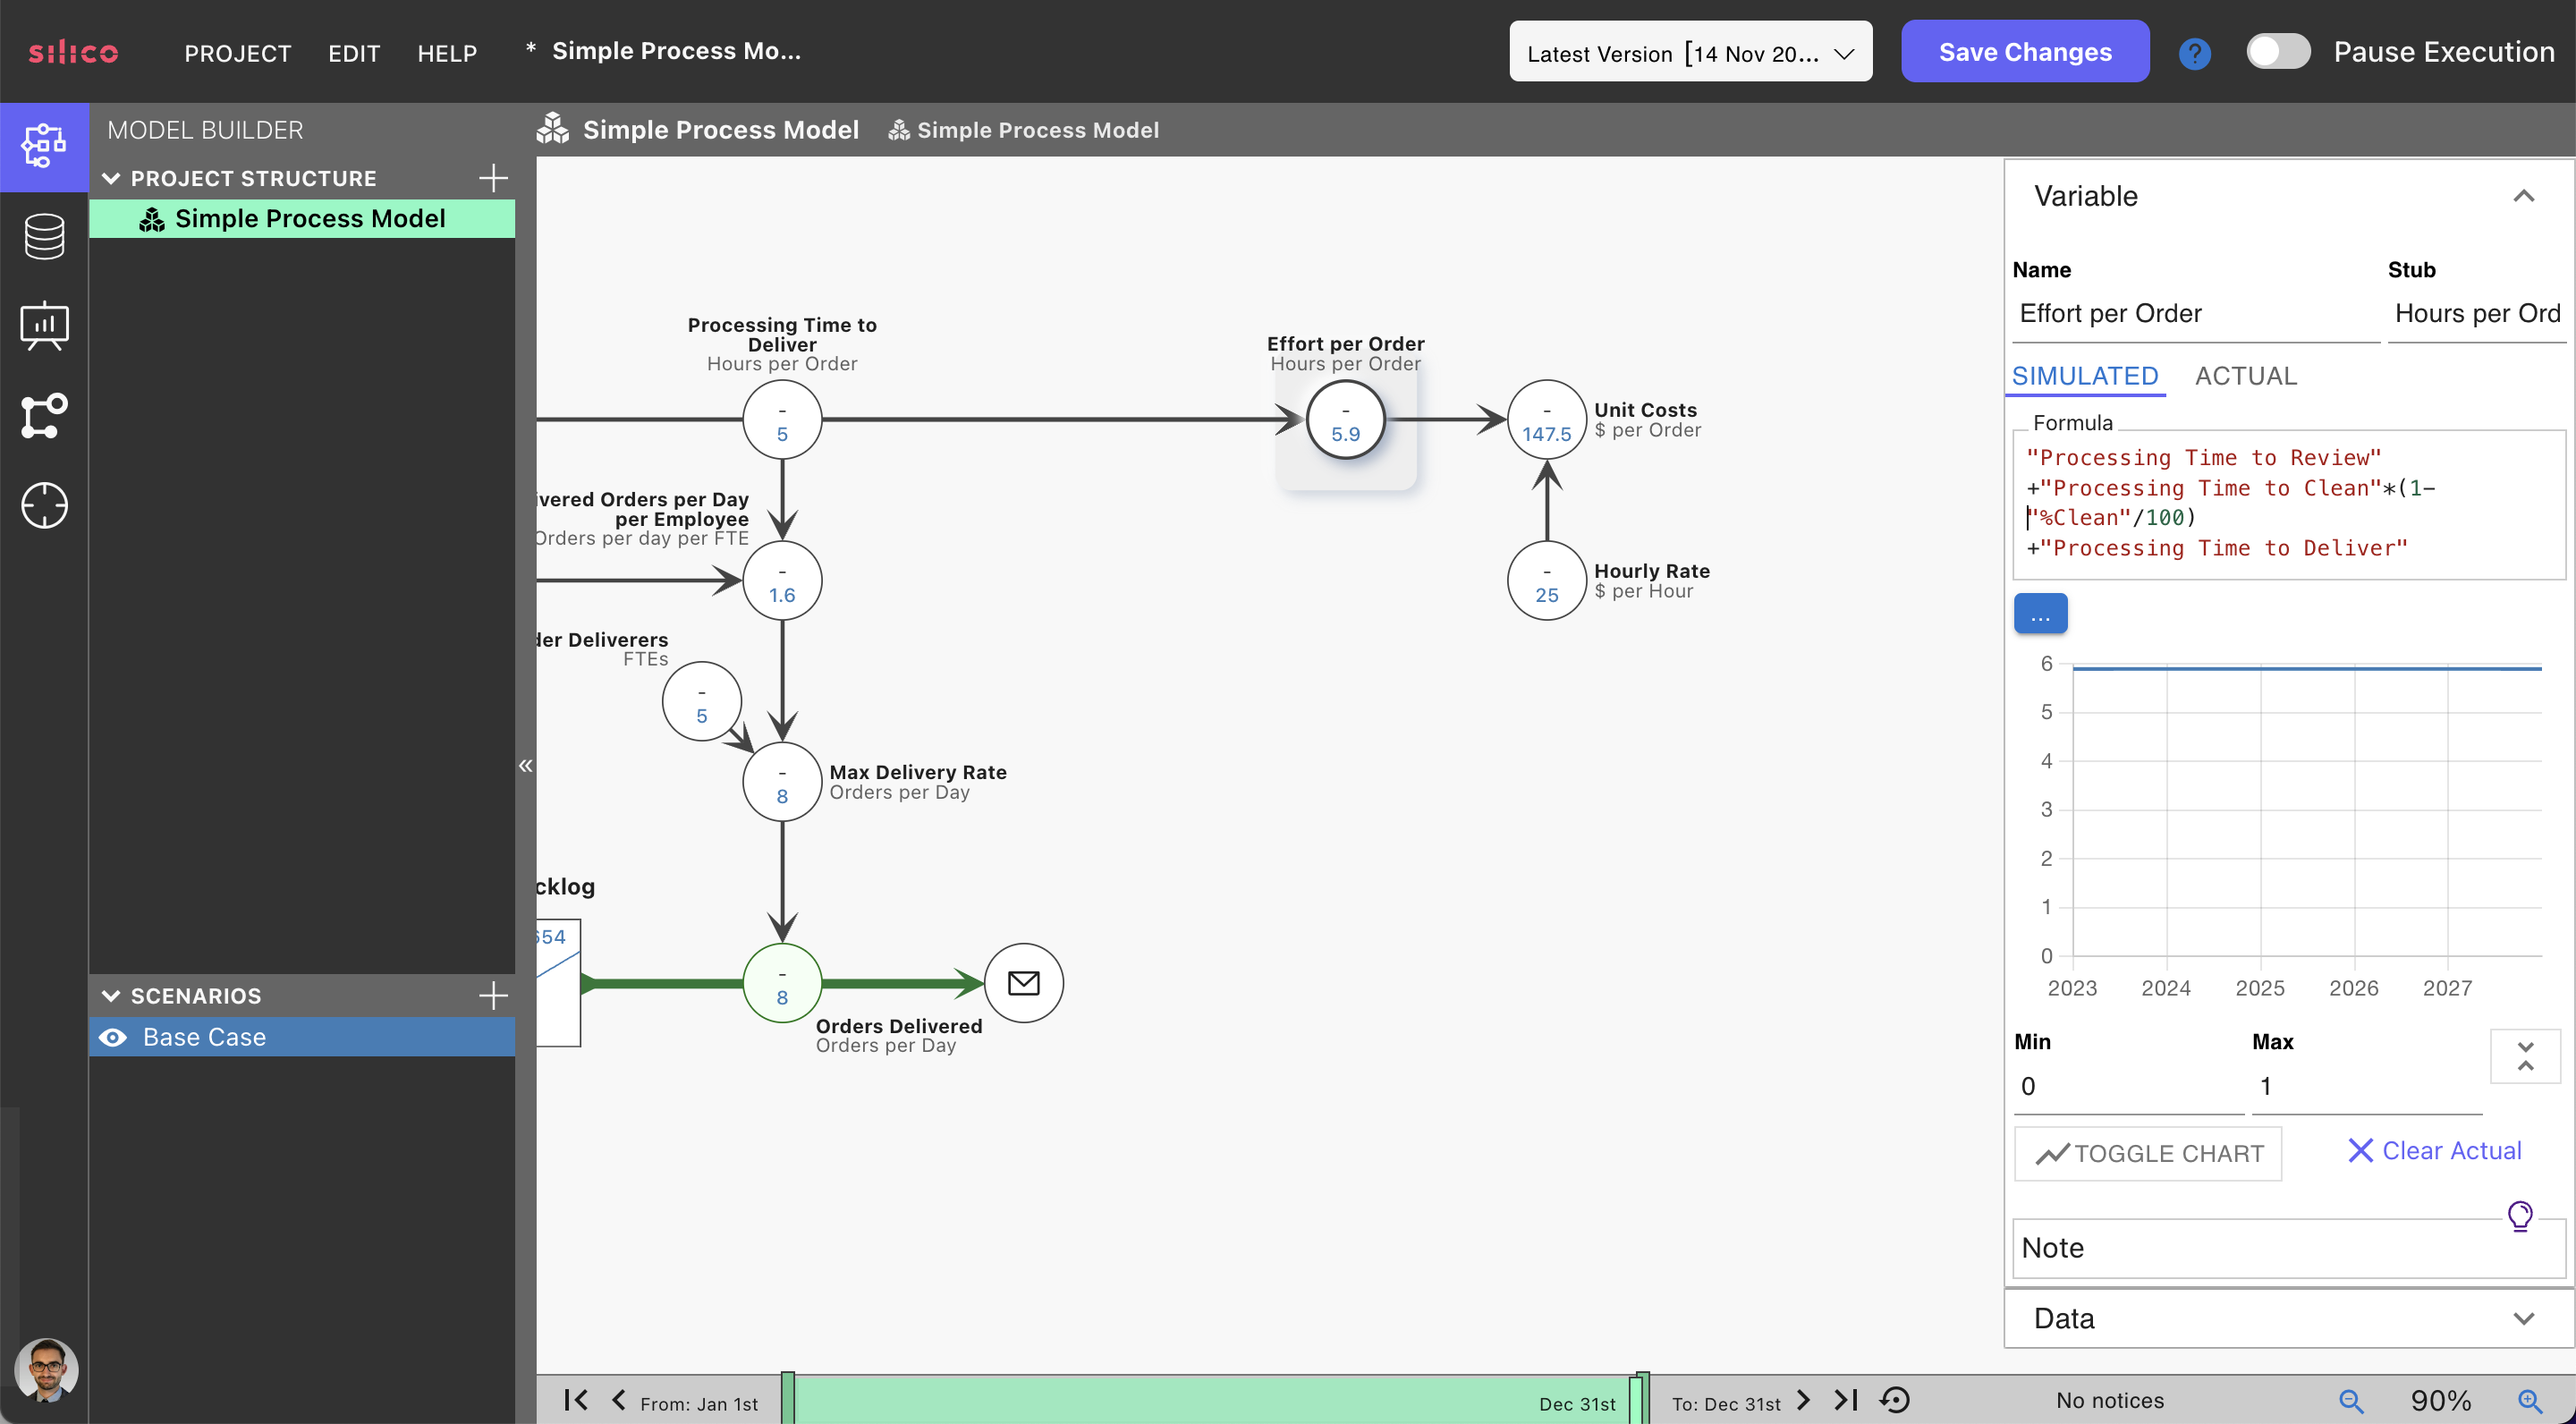
We can easily use the manual effort to calculate a process’s “Unit Costs”. If we know how many hours of manual effort are required to process an order and what each hour costs a company, we can multiply the two to calculate the costs per order of our process. In the screenshot above, we added a variable called “Hourly Rate” and multiplied it by the Effort per Unit to determine the Unit Costs.
Backlogged Cases
An essential intermediary outcome of your process is its backlog or queue size, and you want to pay particular attention to its development over time. We can calculate the total number of orders in the process by adding up the value of all the stocks in the process using a variable called “Orders in Process”.
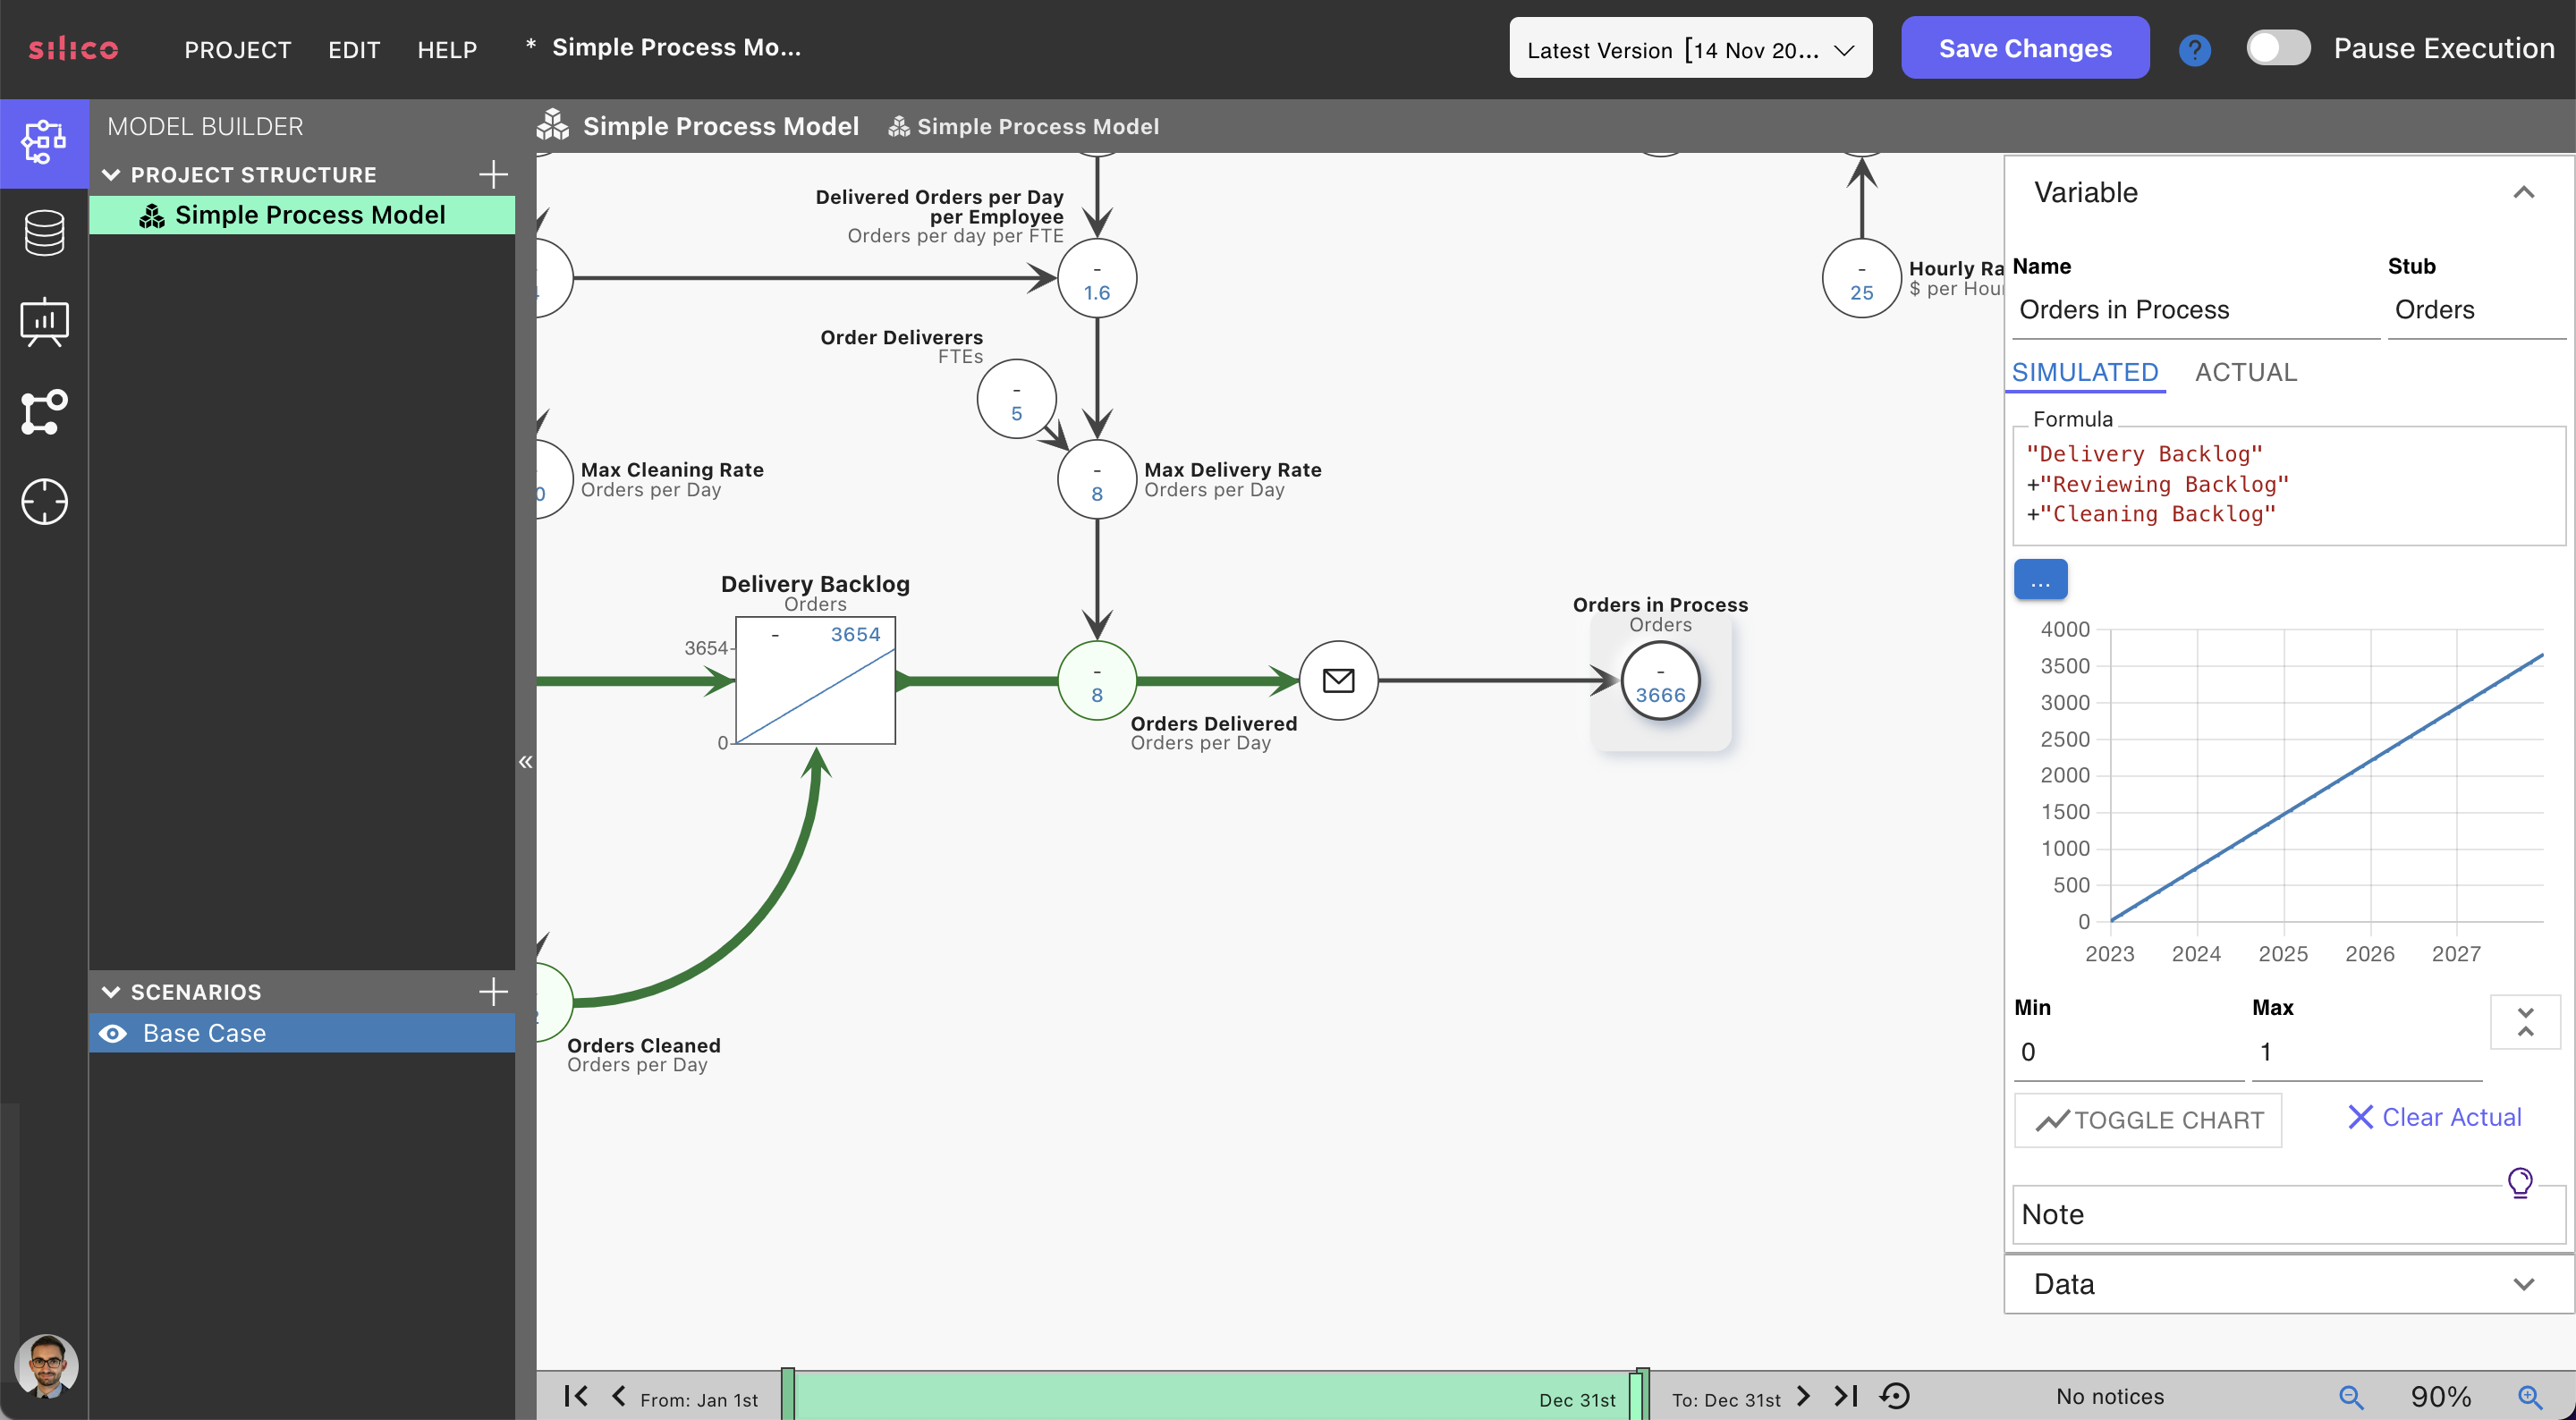
This variable increases over time, which means that orders arrive at the process quicker than they are being processed. This is because our process has insufficient capacity to cope with demand - an indirect outcome of the effort per unit: If processing time were lower, employees could get more done per day, either reducing the speed at which backlogs accumulate or even eliminating increasing backlogs altogether.
Lead Time
If backlogs increase, so will lead times. The lead time captures how long a new case - an order in this case - will be in our process from start to finish. In our example, the lead time specifies the days from receiving to delivering an order. The lead time is a critical outcome because payment and, thus, revenue generation are often dependent on order delivery and fulfilment. Lowering lead times is, therefore, essential to move revenue forward. However, lead times are also a crucial qualitative outcome of our process because fast and on-time delivery will improve customer satisfaction.
We can calculate the time required to clear each backlog by dividing the stock by its outflow. For example, if ten orders are waiting to be delivered and we deliver one order per day, it would take ten days to clear the backlog before we attend to any new orders. We can calculate this time for each backlog and then add up all the individual times to estimate how long an order will be in the process.
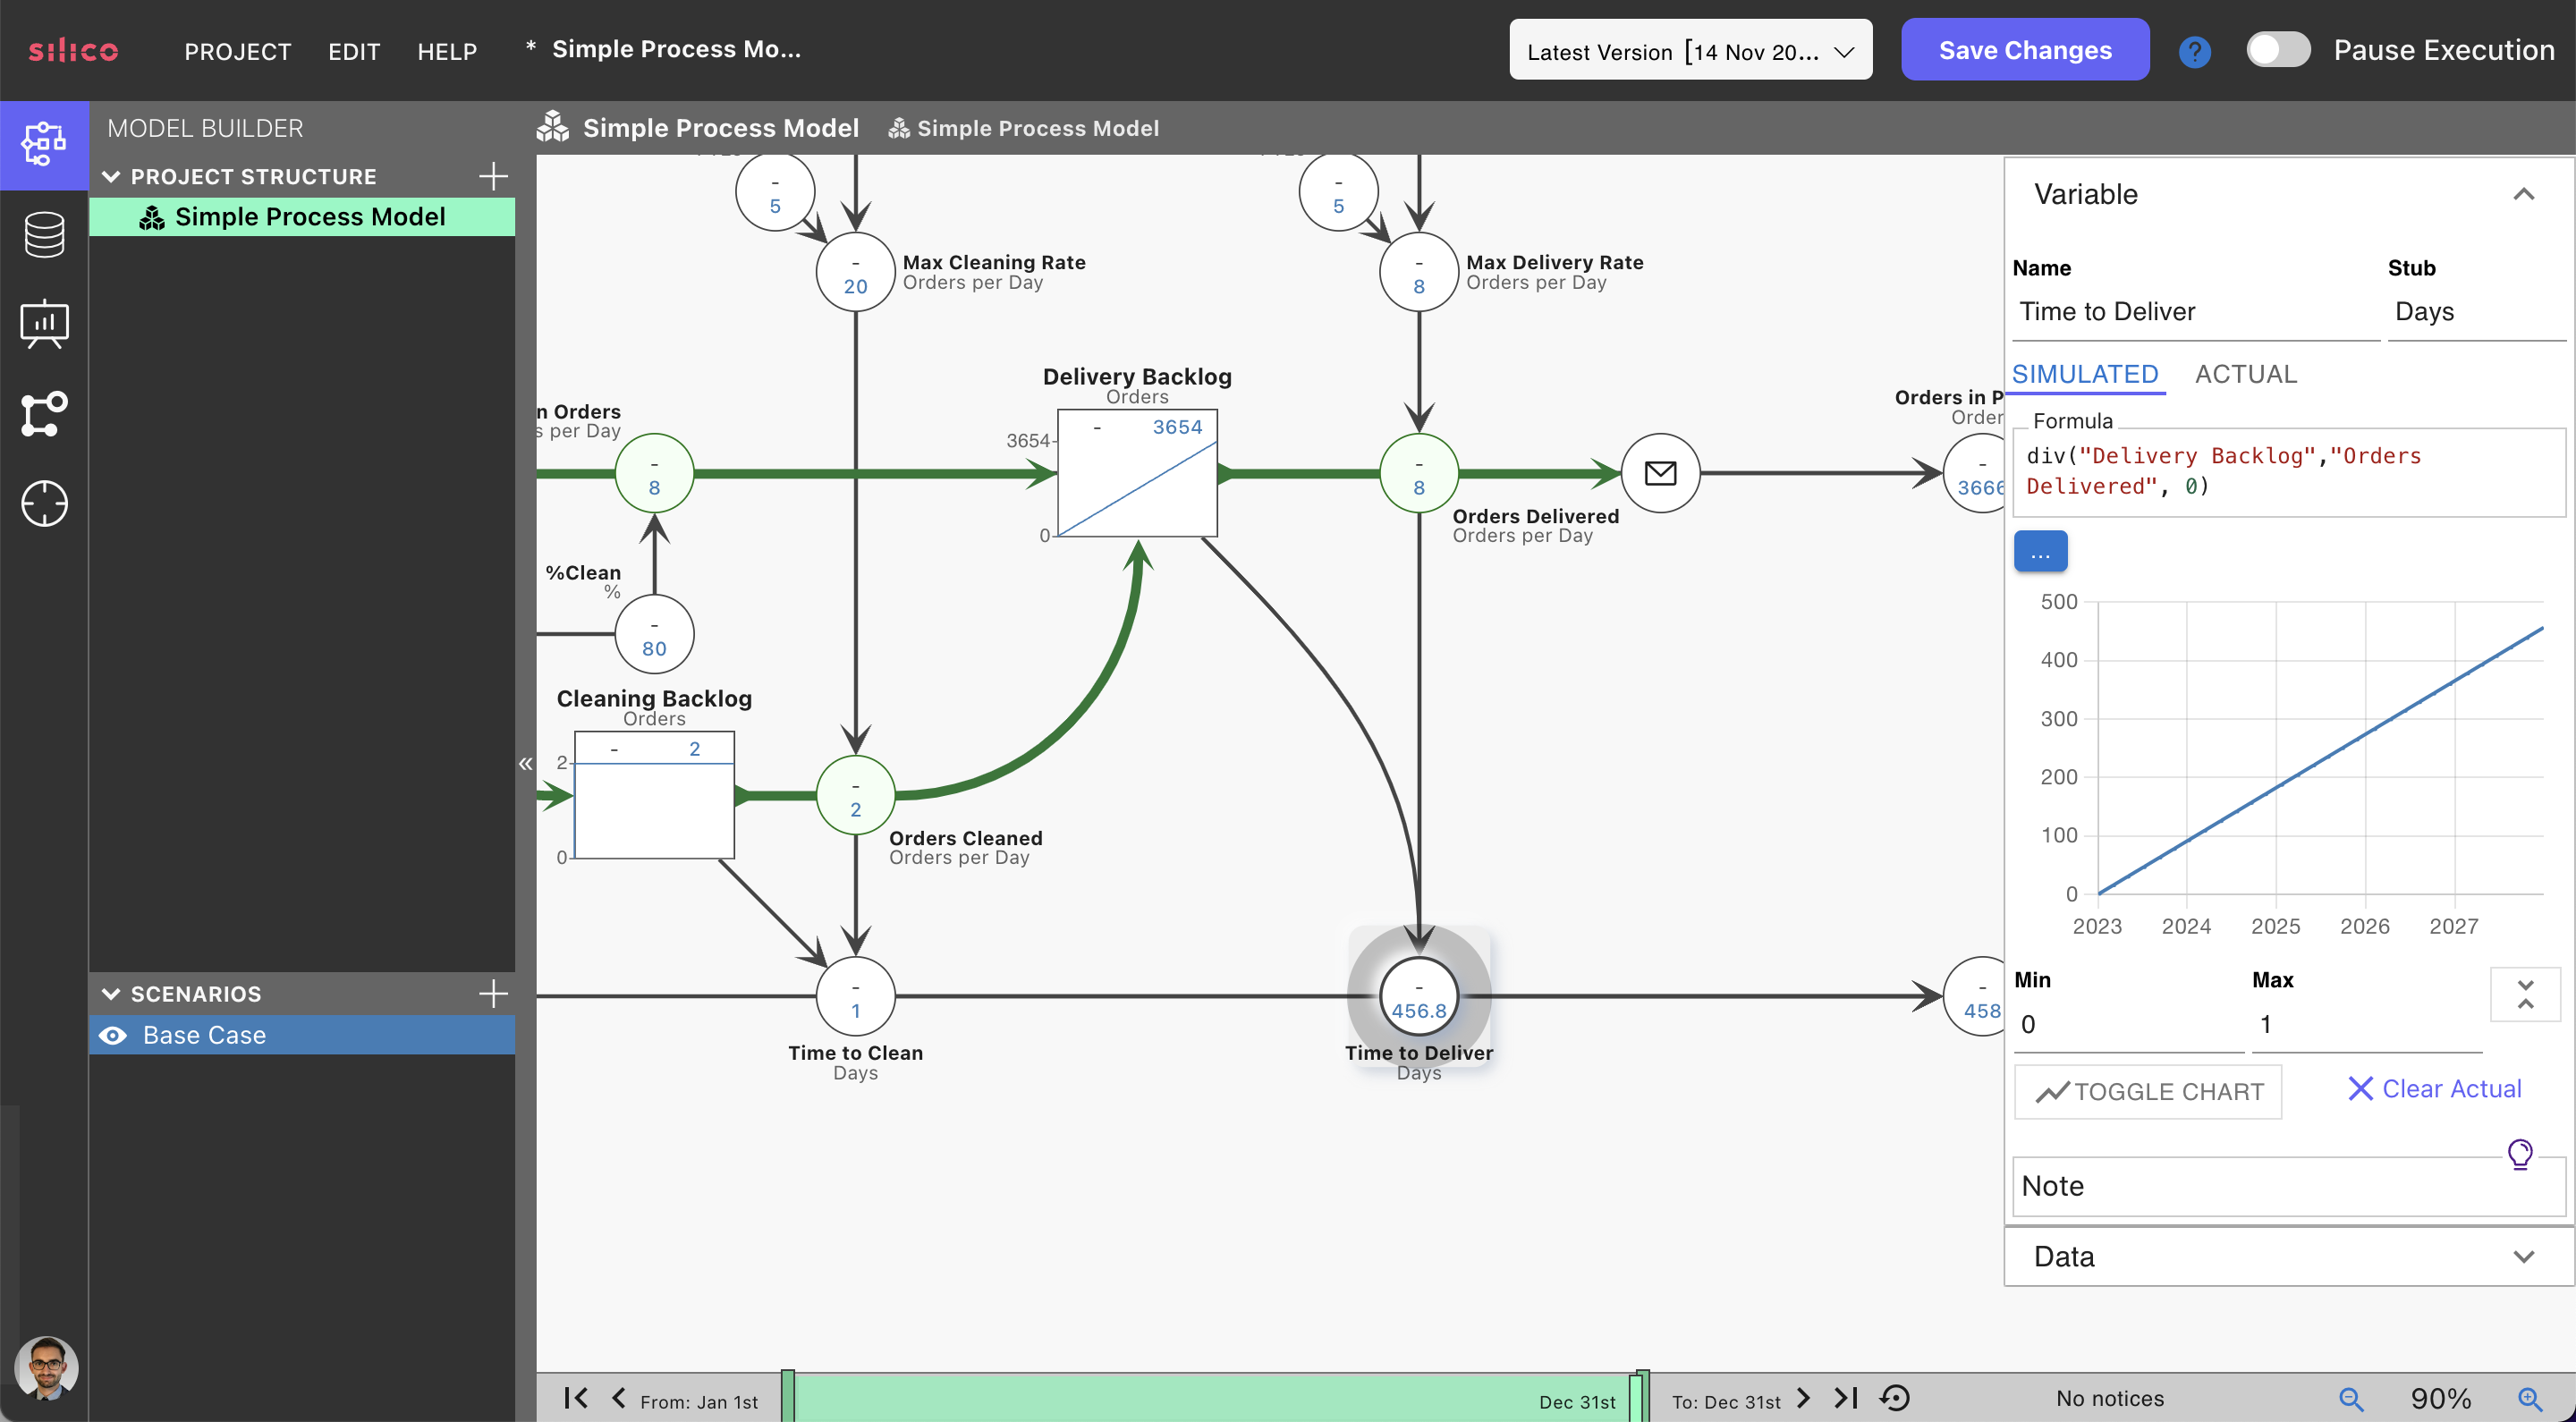
As expected, the lead time increases over time due to growing backlogs. In our example, this is the case due to the last backlog, where the maximum throughput rate is below the arrival rate of new orders requiring delivery. In contrast, the two other backlogs have more than sufficient capacity to deal with demand. This points to some optimisation potential we will leverage in the next blog post.
Revenues
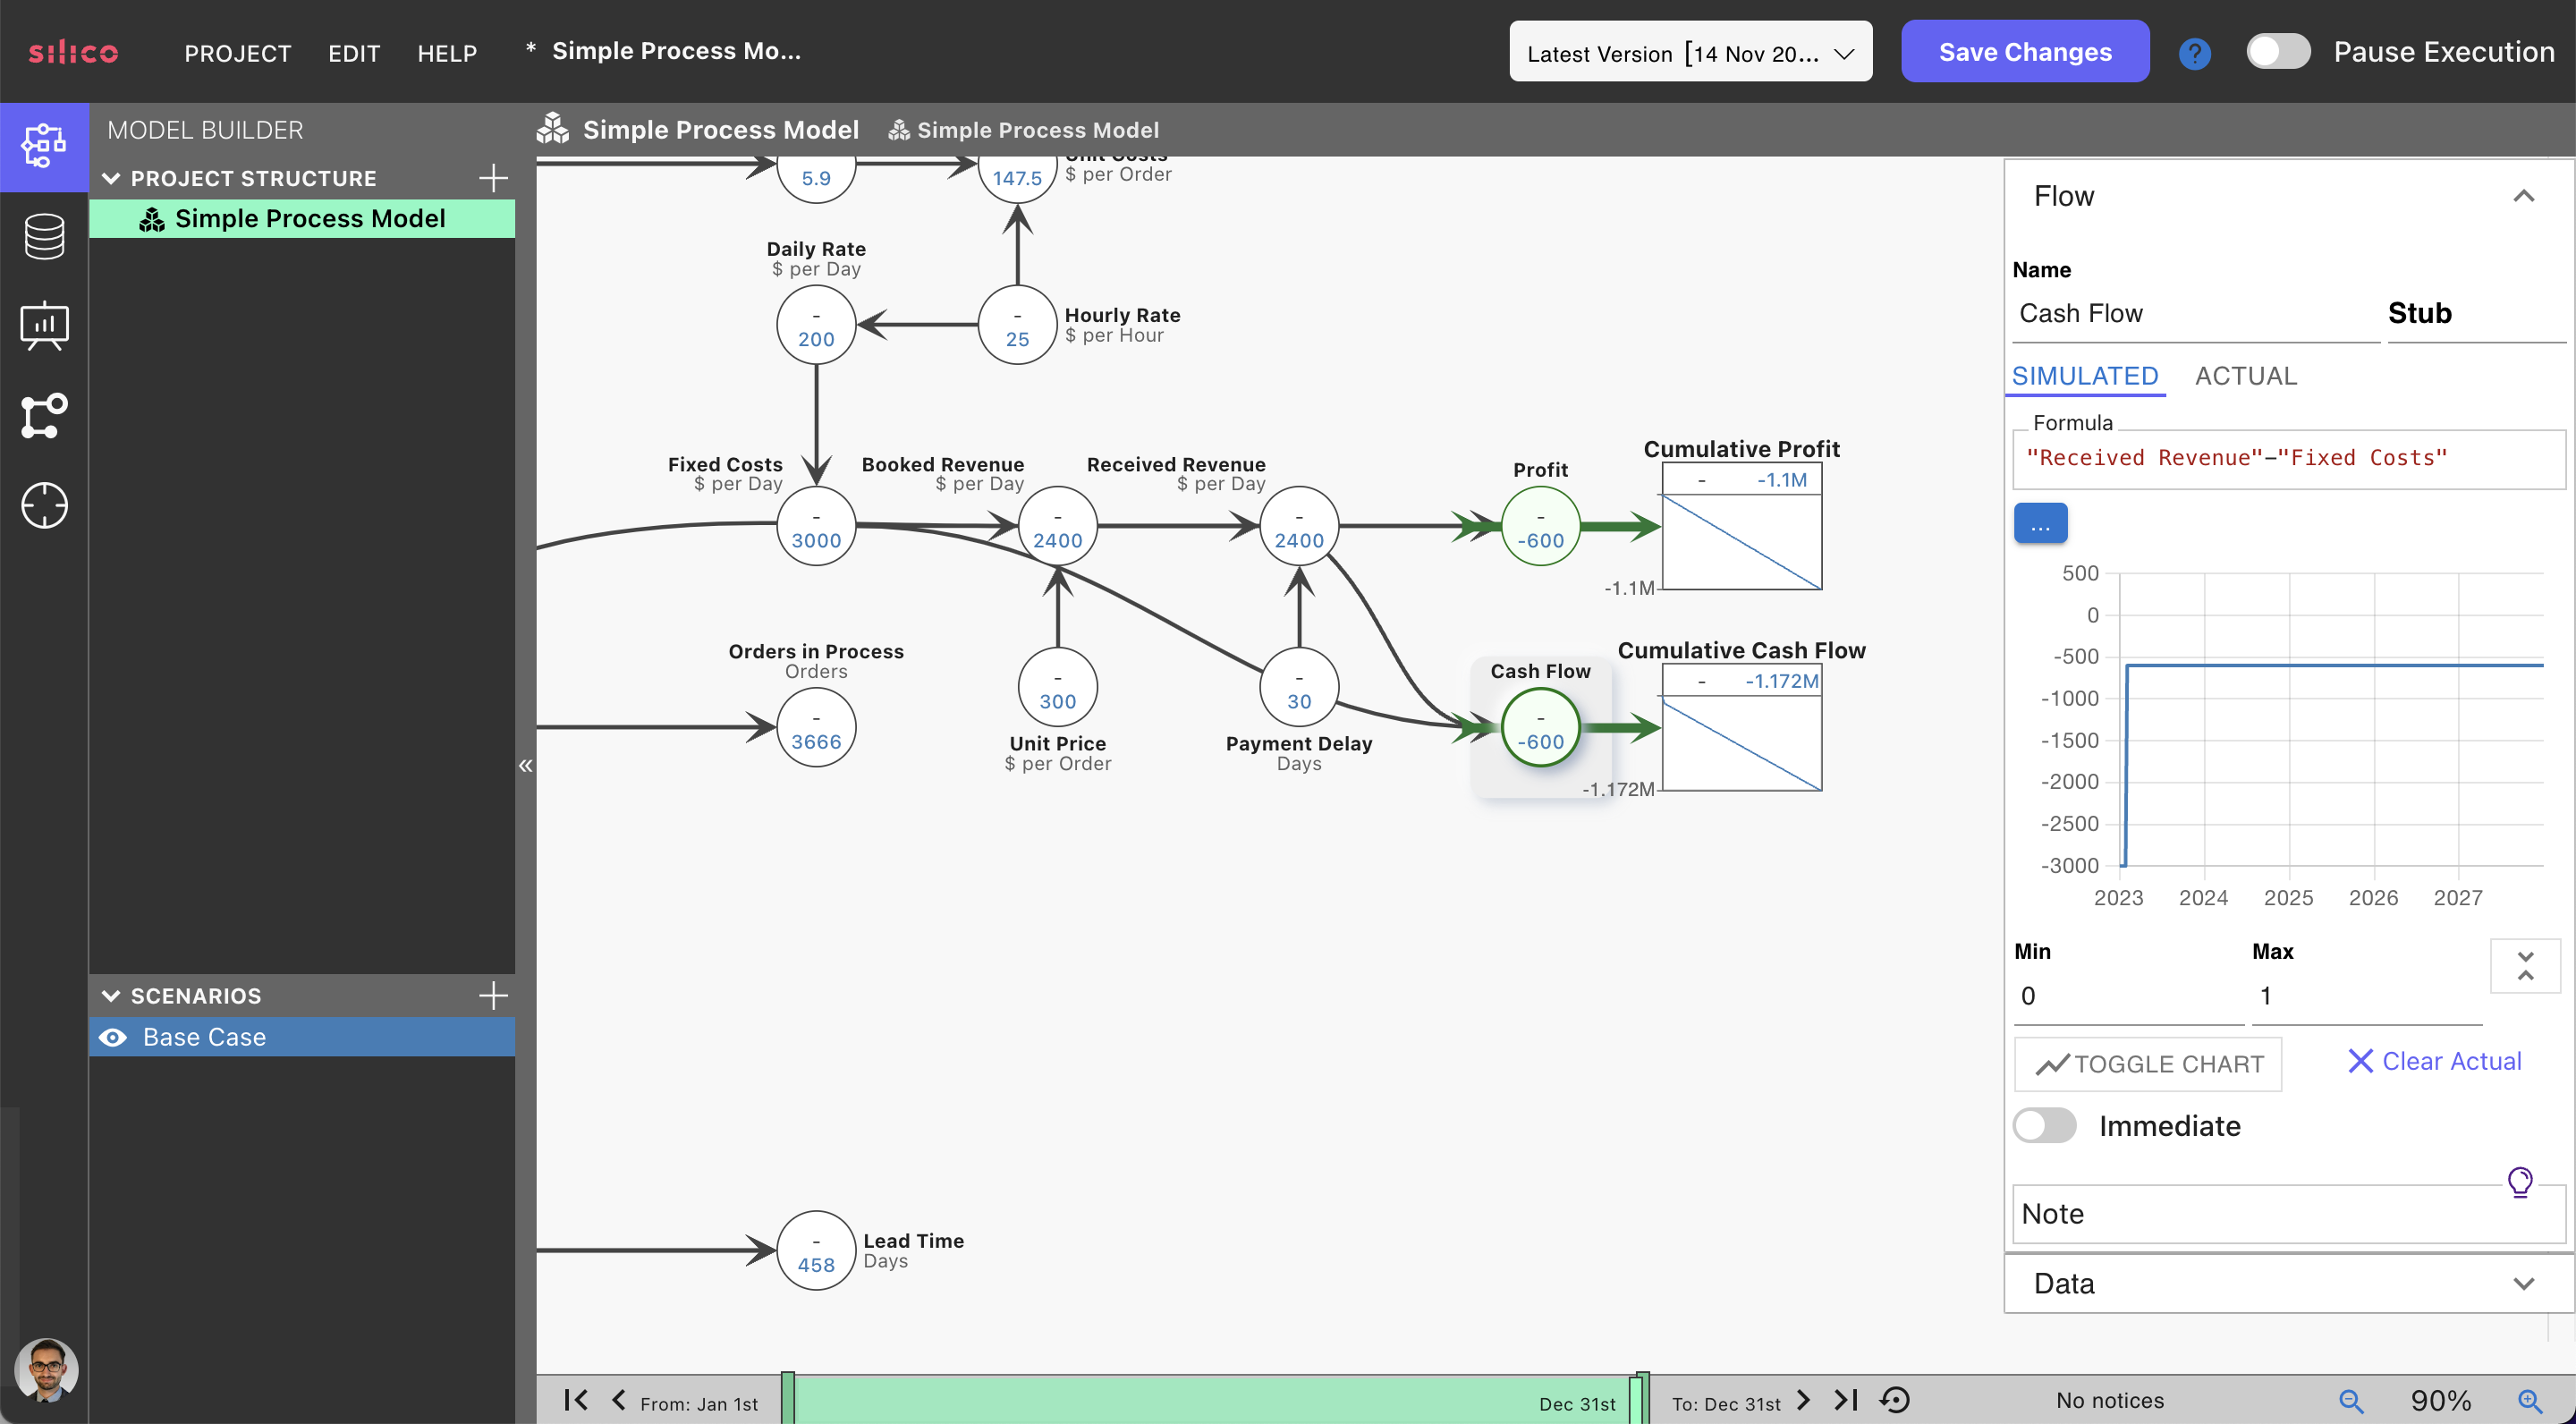
One strength of Silico’s Digital Twins is their ability to link processes directly to business outcomes. “Plug straight into cash flow”, as one of our customers at a large Telco has put it. For example, we may receive payment 30 days after delivering an order. We can represent this by adding to our process structure: Firstly, we create a variable for our product’s “Unit Price” and a “Revenue” variable. Multiplying the “Unit Price” with the “Orders Delivered” results in our “Booked Revenue” per day. Secondly, we can create an additional revenue variable called “Received Revenue” that is equal to our “Booked Revenue” delayed by the 30-day “Payment Delay”.
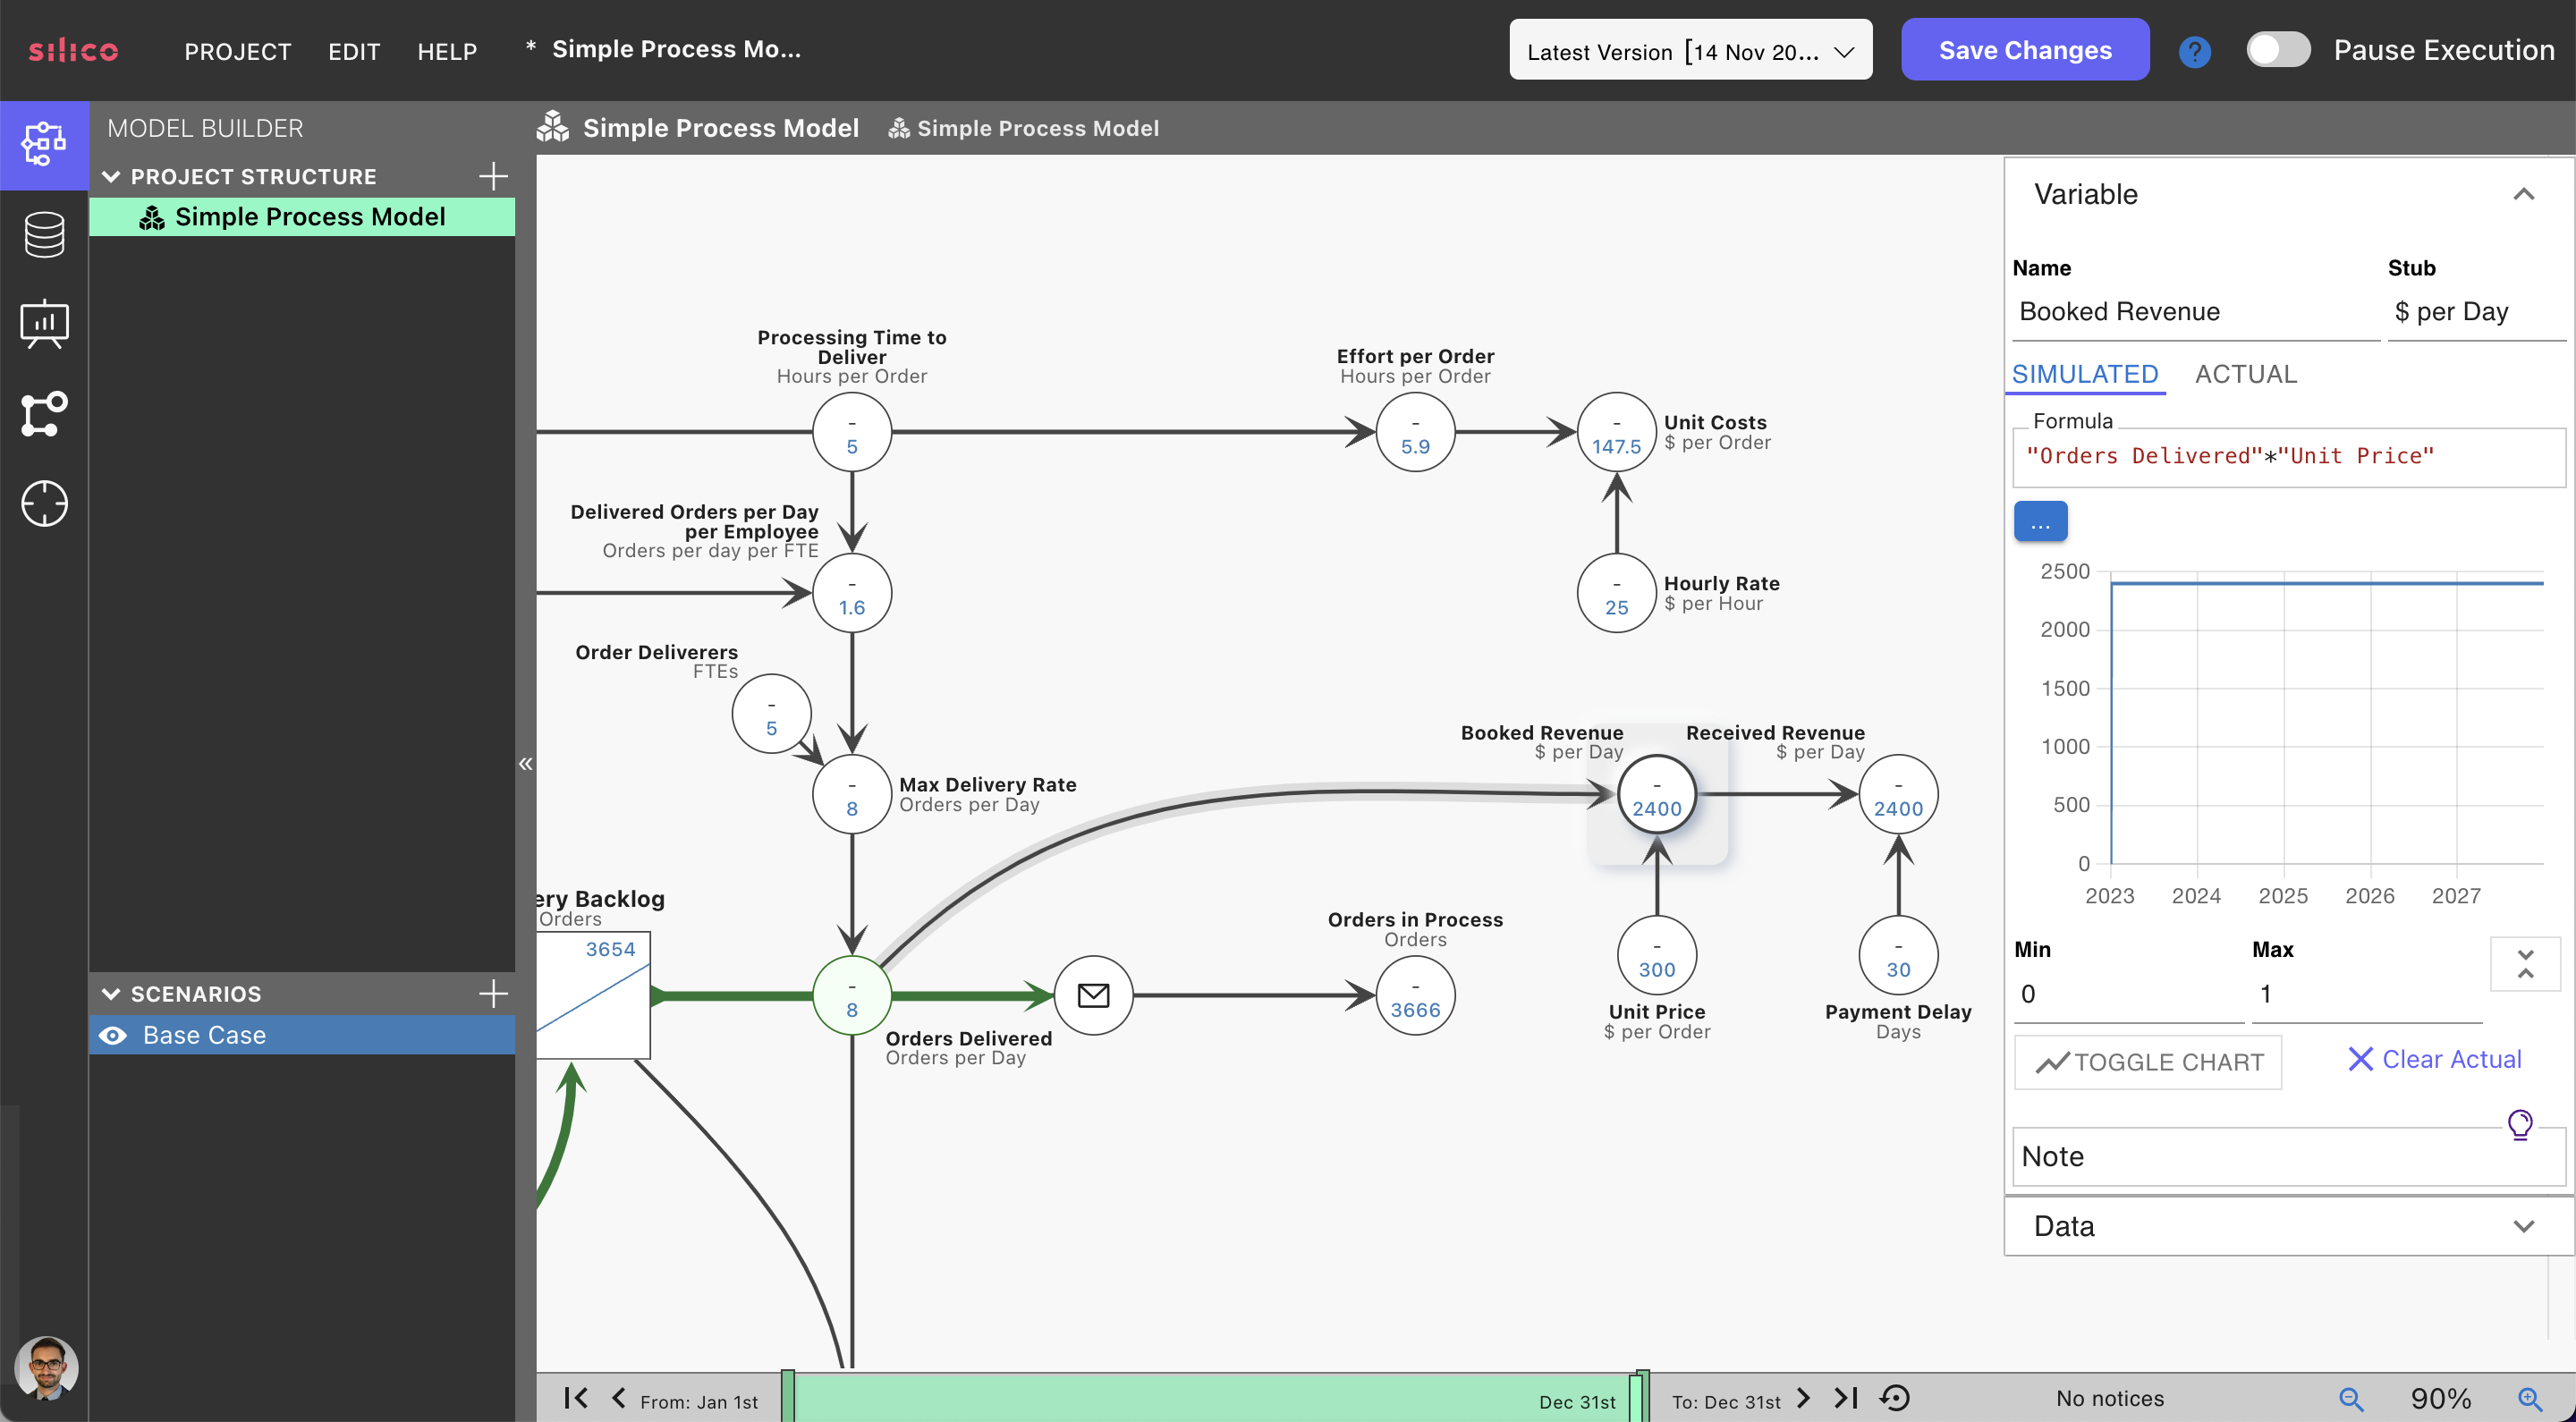
In this case, we have a straightforward payment schedule that considers that customers do not pay on delivery but take, on average, a month to pay for the product. However, Silico can also represent more complex payment schedules currently built in separate, spreadsheet-based financial models. Thereby, Silico can connect processes and financials. That helps, for example, transformation teams to determine the business impact of their transformation initiatives. It also allows operations managers to investigate how, for instance, their resource allocations affect financial outcomes in a single, unified view.
Fixed Costs
We have already calculated the unit costs of the process and could multiply the number of delivered orders with them to calculate the costs of running our process. However, there is a second way to think about the costs of this process: resources as a driver of fixed costs. Instead of starting with the required effort, we could start with the FTE resources in our model, add them up, and multiply them with a “Daily Rate”. This daily rate is the “Hourly Rate” multiplied by the “Hours worked per Day”.
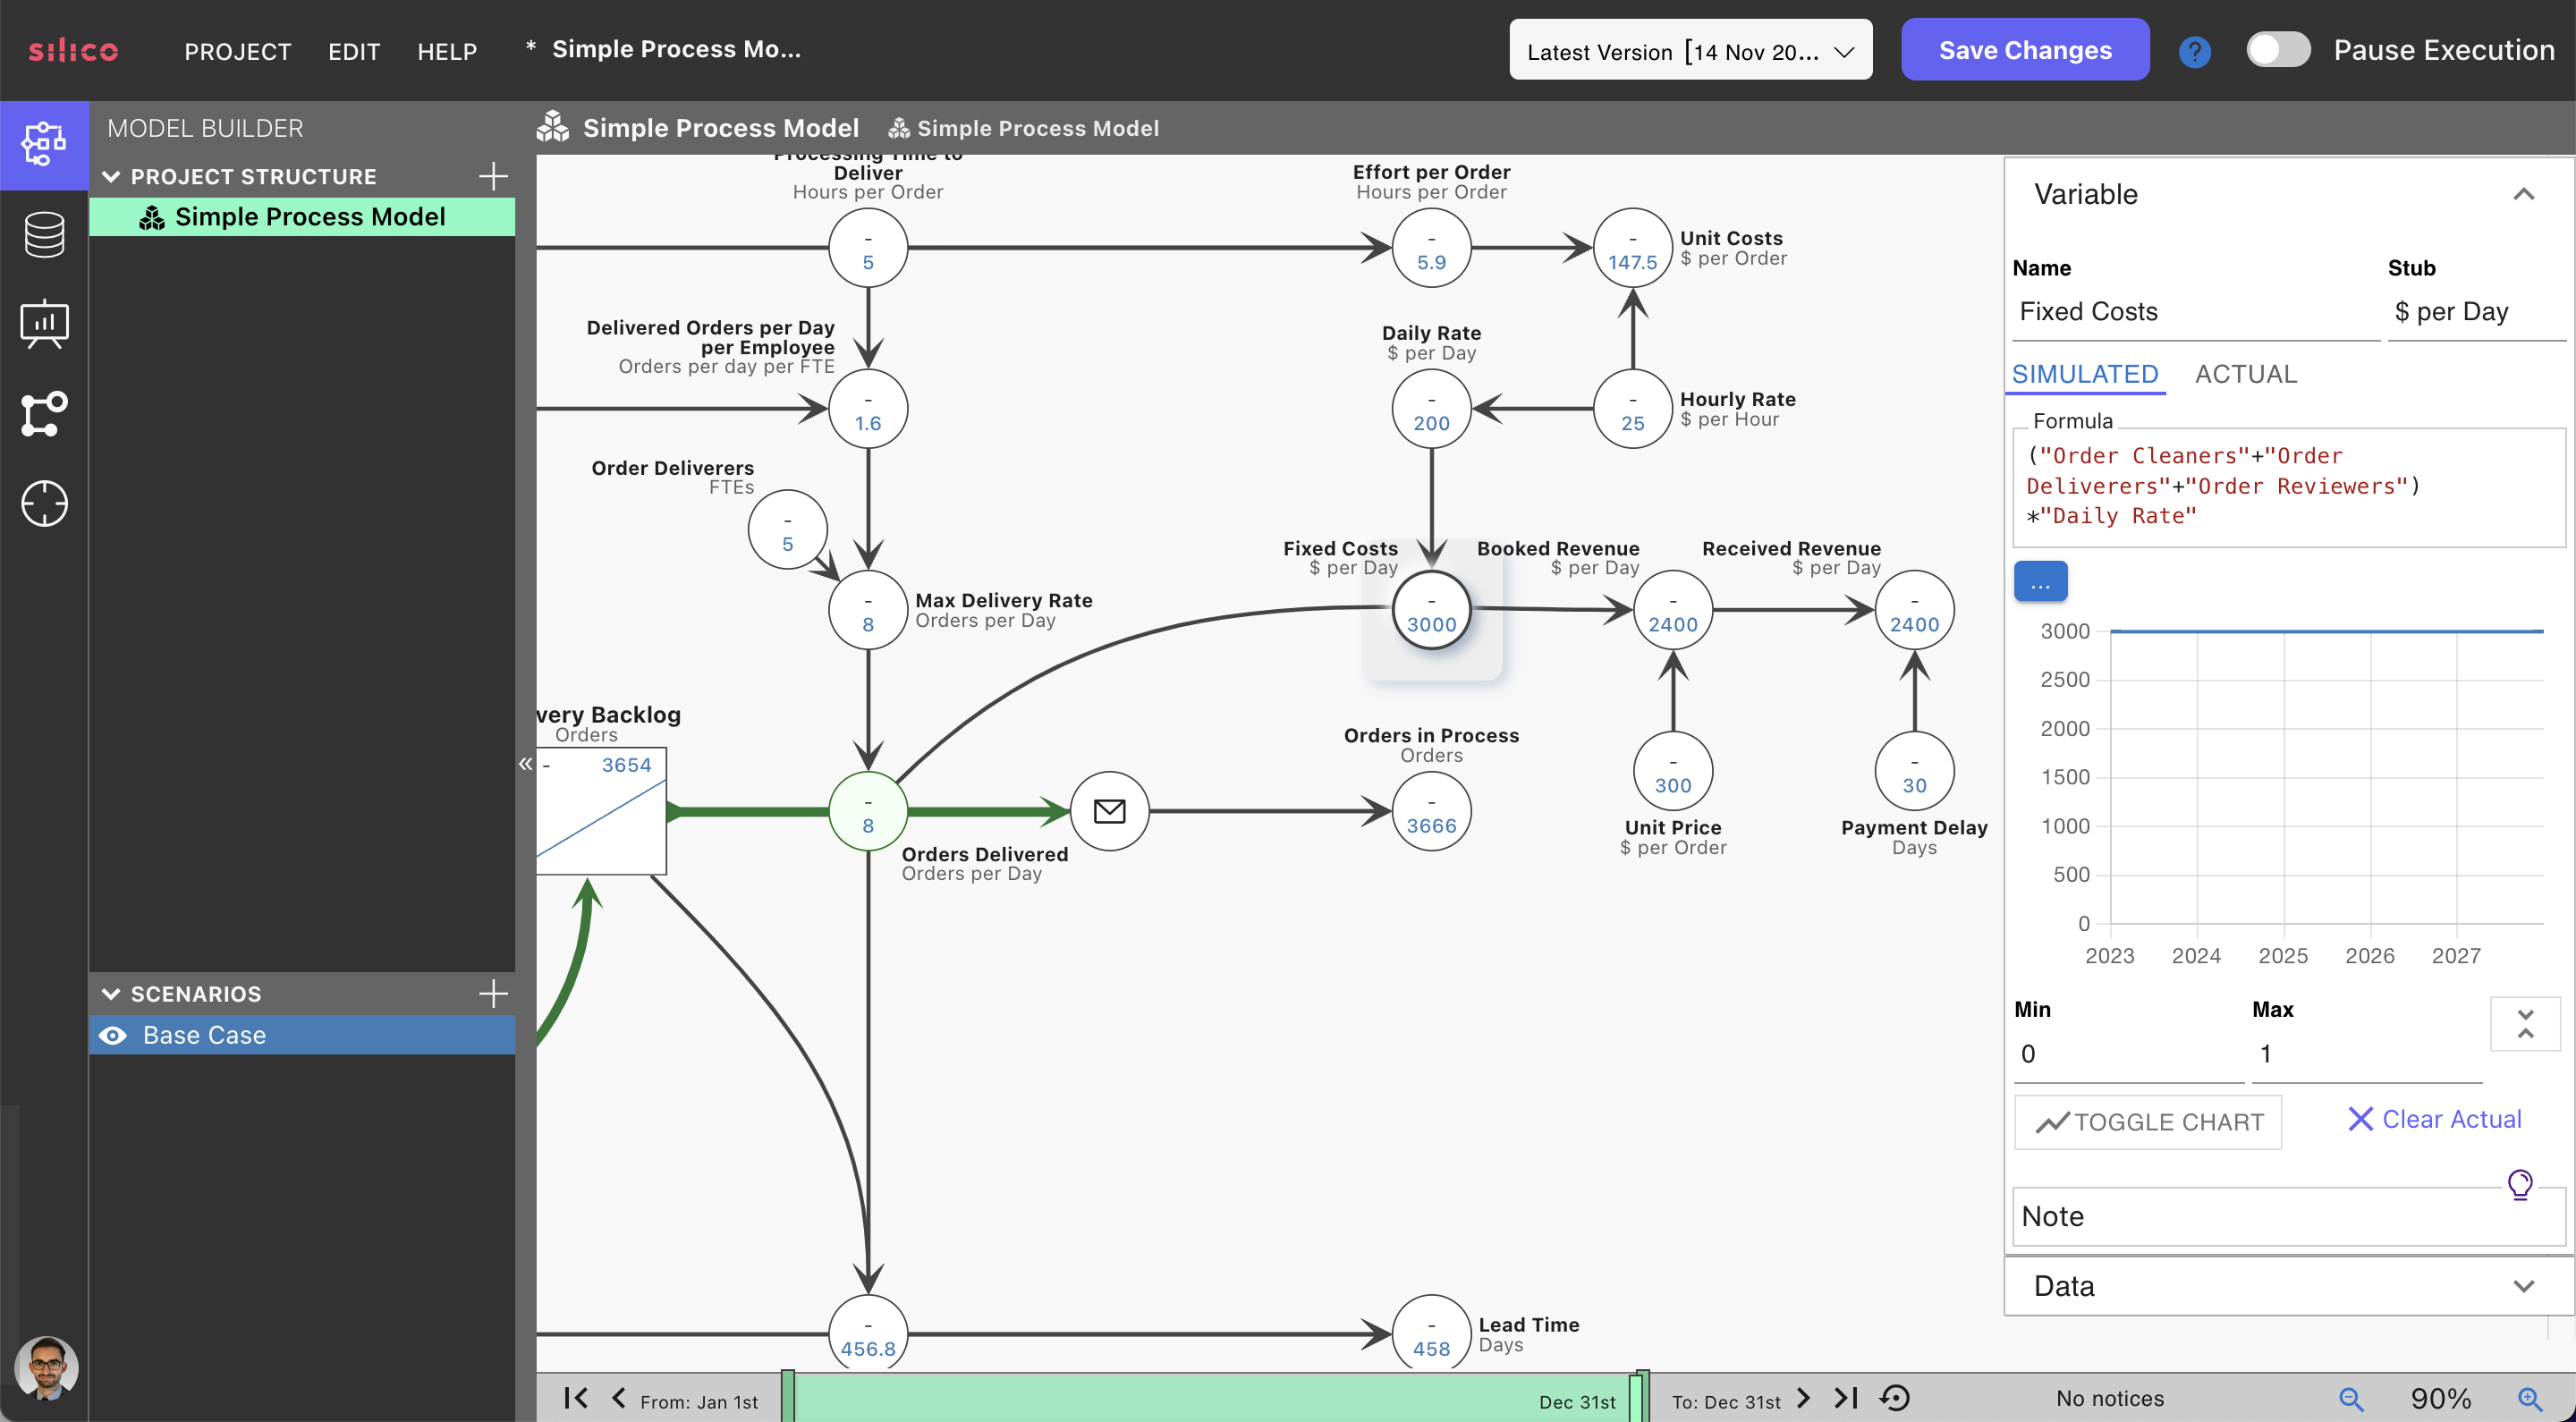
When employees have idle time at some steps in a process, such as the first two steps above, the unit costs and fixed costs methods differ. Which understanding of costs is useful depends on the problem a modeller tries to solve and the circumstances of each business. The fixed cost method may be higher because it also accounts for the time spent when employees are unproductive. If employees spend their idle time doing other activities not covered in the process, using the unit costs may make sense. If employees are idle, the fixed cost method leads to more realistic outcomes.
Profit and Cash Flow
Lastly, we can combine our revenue and cost assumptions into profit and cash flow variables. They subtract the daily fixed costs from, respectively, the booked or received revenue. Therefore, they express the profit or cash flow generated daily, and we can cumulate our daily profit and cash flow using stocks.
Silico can add and consider other factors besides those driven by the process itself. Thereby, entire margin forecasting models can be built to complement and expand process twins. For process transformation teams and process owners, margin forecasting models can provide a more holistic view of the impact of their work. For finance teams, adding process twins to their margin and cash flow forecasting twins improves the accuracy of their forecasts and optimisations, for example, by having a better view of when orders will be delivered and trigger payments.
Conclusion
In this blog post, we have linked our process model to key business outcomes such as effort and unit costs, backlogs, lead times, revenue, costs, and cash flow or profit. These different business outcomes affect one another: lowering effort means that the same number of employees can process more cases per day, which lowers backlogs. Lower backlogs mean fewer cases, such as orders, must be processed before new ones are processed, reducing lead times. Lowering lead times means that orders are delivered quicker, moving revenue forward. Moreover, effort reduction lowers unit costs and, if it results in a resource reduction, fixed costs of the process. The difference between revenue and either cost measure can then be used to calculate profit and cash flow.

How to Move Forward with your Key Business Outcomes
With this structure set-up, we can now start investigating the impact of any changes on our process using the Digital Twin. These may include, for example, the allocations of employees in a way that maximises profit; we can analyse and future-proof our process; investigate the impact of process changes. We will address those three topics in future blog posts.